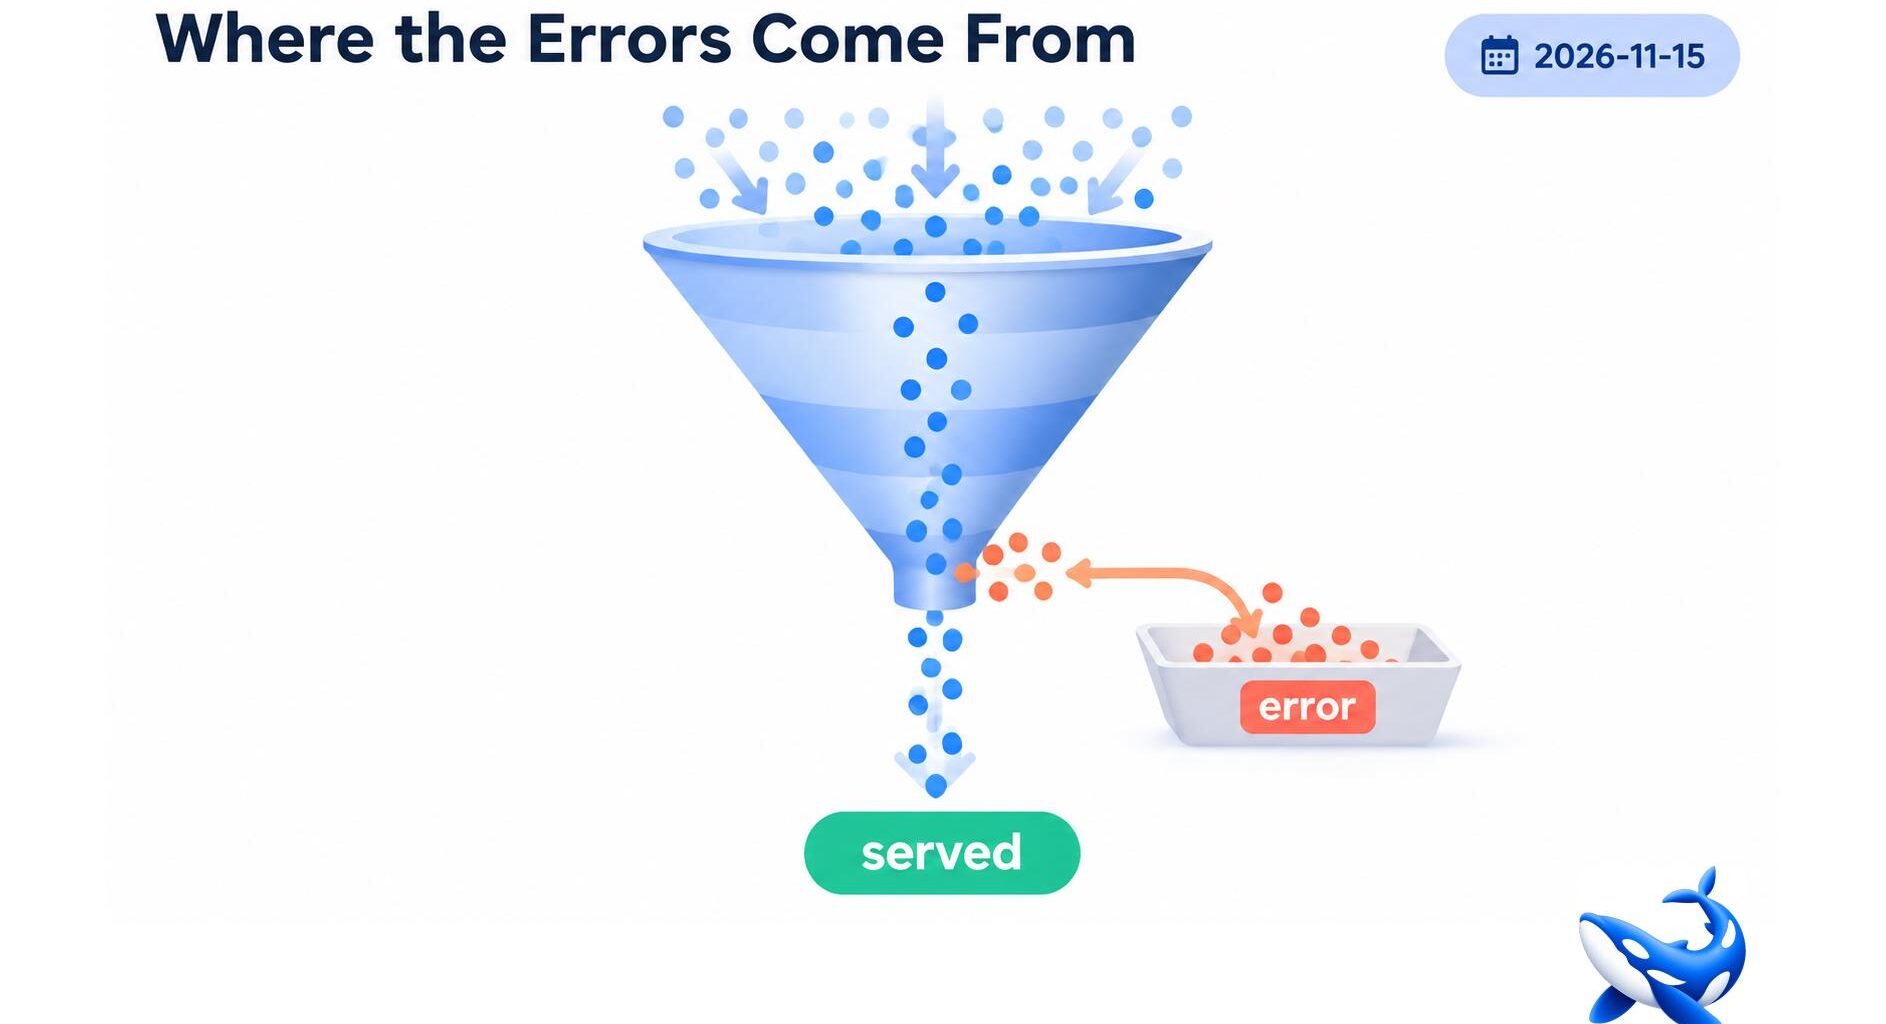
The highest error rate in OrcaRouter‘s cyber tier belongs to GLM 5.3 abliterated at 16.110% over the seven days to 2026-11-15. Its base checkpoint reports 0.582% over the same window [OURS].
That is 27.7 times the error rate of the model it was built from, and reading it as a reliability problem is the most common mistake a buyer can make on this page.
What the error counter counts
Every card’s error rate is computed by the same harness over the same window: a request is sent, and either it returns or it does not. A non-return is an error.
For an abliterated card, three different things produce a non-return, and only one of them is the model failing.
Authentication and authorisation failures come first. All eight abliterated cards are `locked: true`, `required_tier: sec-uncensored`, `required_band: offensive`. A caller without the tier, or with a key that has not accepted the offensive-capability terms, gets a rejection. That rejection is recorded as an error [OURS].
Refusals at the endpoint come second. A hosted “uncensored” model can still be declined by policy before the weights are reached — the request arrives, the gate looks at it, and the call does not proceed.
Actual serving failures come third: timeouts, capacity, a malformed parameter, a model-side crash.
The harness cannot distinguish them, so the row is the sum. On a card with a heavy gate, the first two can dominate.
Why GLM 5.3 is the extreme case
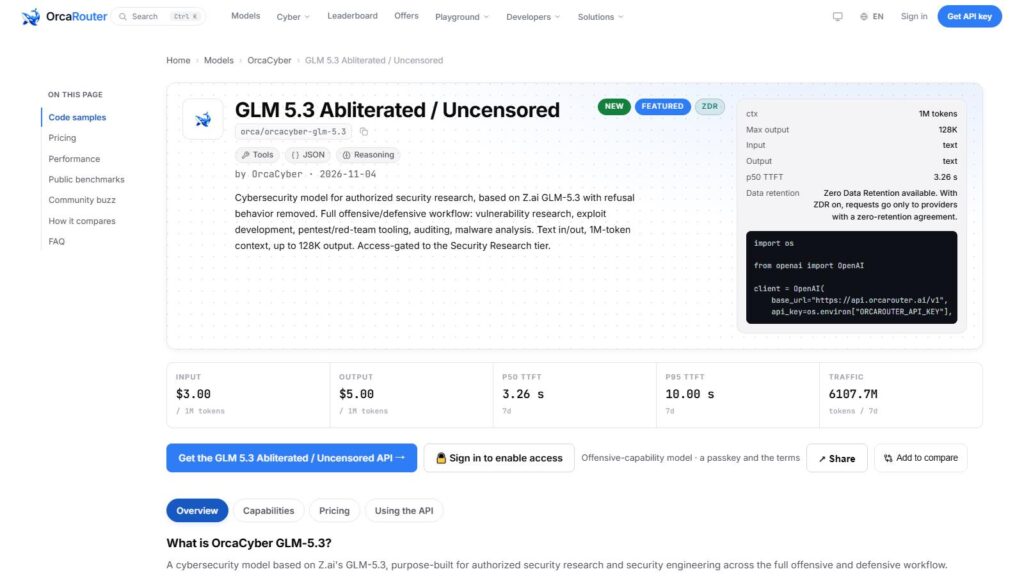
Because it combines the widest gap to its base with the smallest call volume per unit of traffic and the most expensive input rate in the tier among the abliterated cards at $3.00 [OURS].
A gate that rejects a fixed share of attempts produces a higher error rate on a card with fewer attempts. GLM 5.3 carried 6.03 billion tokens in the week at a 128,000-token output ceiling and 87.4 tokens a second, against a base that carried 10.91B [OURS]. Fewer, longer calls through the same gate is exactly the shape that turns a small number of rejections into a large percentage.
The counter-check is Kimi K3.1 Pro, which sits at 1.306% against a base of 6.545% — the card errors a fifth as often as its own base [OURS]. If the error counter were measuring model reliability, that direction would be remarkable. As a gate measure it is unremarkable: Kimi’s base is the noisier endpoint.
Same harness, same window, opposite signs. The only consistent reading is that the row describes the path.
What the gate does to a real pipeline
A 16.110% rejection rate is an operational fact, whatever its cause, and it costs real money.
At 87.4 tokens a second and a $3.00 input rate, a rejected call that was already streaming has paid for its input tokens and produced nothing usable. On a batch of 10,000 calls averaging 2,000 input tokens, 1,611 rejections burn $9.67 of input for zero output, before the retries are counted [OURS, our arithmetic on the published rates].
The bigger cost is wall clock. A retry policy that re-sends every failure once doubles the effective request count for a sixth of the batch, and on a pipeline with a fixed nightly window that is the difference between finishing and not.
Three ways to reduce it, in order of return.
Warm the gate before the batch. A single successful call with the production key establishes the tier and band state; a batch that starts cold pays the setup cost once per worker.
Retry only what is retryable. A rejection for a missing tier will be rejected again identically; a timeout will not. Classifying on the response body rather than the status code cuts the retry volume to the third category.
Run the cheap card first. A 0.166% error rate on DeepSeek V4.1 Flash costs almost nothing to try, and routing only the ambiguous cases to the expensive card keeps the expensive card’s rejection count small in absolute terms.
What the row is good for
Two things, both worth having.
As a change detector it is excellent. If a card’s error rate moves from 0.7% to 16% between two snapshots, something changed in the path — a gate tightened, a tier requirement added, capacity lost. The row tells you to look even though it does not tell you what you will find.
As a comparable across cards on the same day it is usable, with the caveat that the mix of causes differs. Two cards at 0.7% are probably comparable; a card at 16% and a card at 0.2% are describing different gate behaviour as much as different reliability.
What the row is not good for is a reliability claim in a procurement document. For that you need a controlled run with a provisioned key, and the harness’s number will not predict yours.
The three cards with no gate penalty to speak of
MiniMax M3.1 Flash at 0.272%, DeepSeek V4.1 Flash at 0.166% and Zero 1.0 at 0.183% all sit under three tenths of a percent [OURS].
Those three are the cards whose error row can be read as service quality, because the gate is not producing enough rejections to move the number. If you need a reliability figure you can put in a review, it comes from one of them.
Everything above one percent should be read as a description of onboarding. 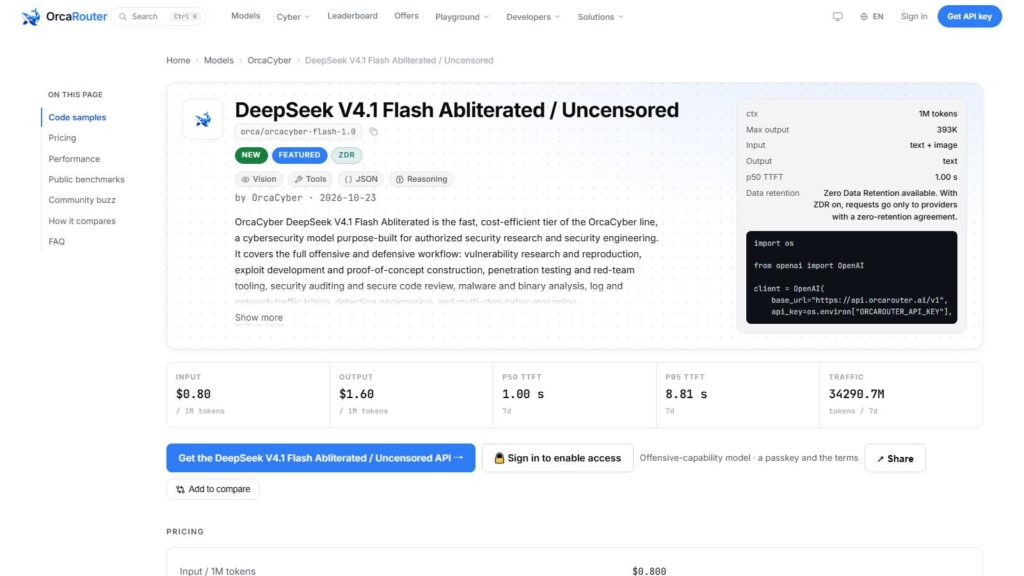
The short version
16.110% on GLM 5.3 against a base at 0.582% is not a model that breaks one time in six. It is a card whose access gate rejects enough attempts to dominate the counter.
The tell is Kimi K3.1 Pro, where the same harness reports the opposite direction — 1.306% on the card against 6.545% on its base. A row that moves both ways across eight cards with one gate design is describing the path.
Use the row to detect change and to compare cards on the same day. Do not use it as a reliability claim, and treat anything above one percent as an onboarding number rather than a defect.
Sourcing note: prices, context windows, output ceilings, modalities, quality scores, latency, throughput, error rates, traffic and access flags are read from the eleven cards’ public model data on 2026-11-15, with seven-day windows ending that day [OURS]. Retry and rejection costs are our arithmetic on the published rates. No benchmark rows are quoted here.